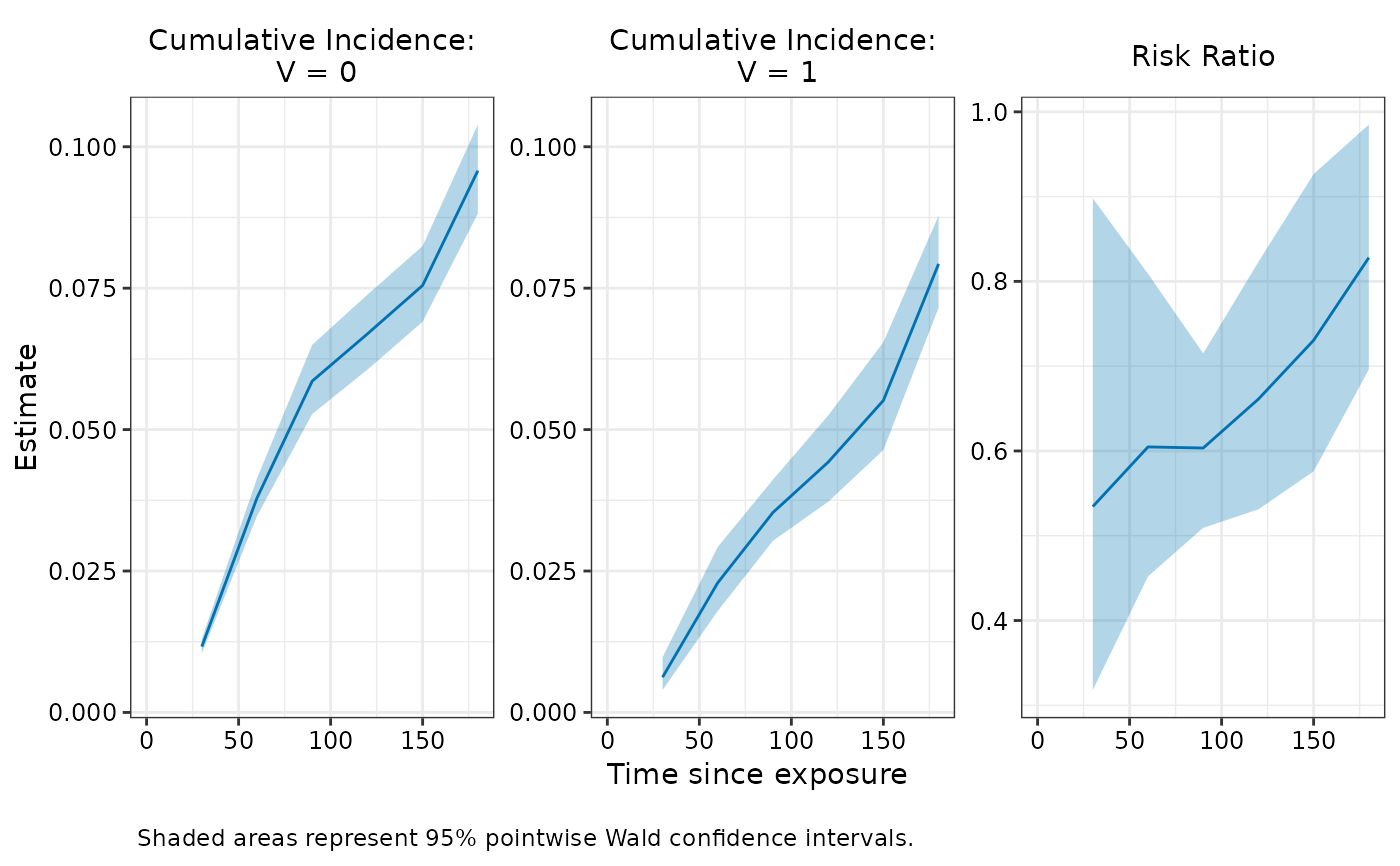
Create a panel plot of cumulative incidence and effectiveness estimates across all evaluation time points.
Arguments
- x
An object of class
nomatchfitcreated bynomatch()ormatching().- effect
The effect measure to plot next to the cumulative incidence plots. Either
"risk_ratio"(default),"relative_risk_reduction"or"risk_difference".- ci_type
Character string specifying the type of confidence interval band to plot, one of
"wald", "percentile", "simul", or"none". Must choose aci_typewhose lower and upper bounds are already computed inestimatescomponent ofx. Uses"wald"by default if available.- color
Aesthetic value to map data values to. Default:
"#0072B2"(blue)- ...
Additional arguments (currently ignored).
Value
a ggplot2 object with three faceted panels (for cumulative incidences and the chosen effect measure)
Details
The two cumulative incidence panels share y-axis limits. The effect measure panel has its own independent y-axis scaling.