![]()
A matching alternative for more efficiently evaluating effectiveness of interventions using observational data
Description
The nomatch package uses a G-computation style estimator to compute the effectiveness of a binary intervention in observational cohort studies that use the target trial emulation approach. The proposed estimator tends to produce similar point estimates as matching-based estimators but can be more efficient.
Installation
You can install the development version of nomatch with:
# install.packages("devtools")
devtools::install_github("ewu16/nomatch")
Example
This minimal example shows how to use nomatch to obtain cumulative incidences and their derived effect measures such as risk differences (RD), risk ratios (RR), and relative risk reductions (1 - RR).
We use a simple simulated dataset based on an observational vaccine study, although data from other disease settings can be used.
# Load package
library(nomatch)

# View example data
simdata <- as_tibble(simdata) #for prettier printing
head(simdata)
#> # A tibble: 6 × 7
#>      ID    x1    x2     V D_obs     Y event
#>   <int> <int> <int> <int> <dbl> <dbl> <dbl>
#> 1     1     1     7     1     2    92     0
#> 2     2     0     7     0    NA   210     0
#> 3     3     0    11     1    35   210     0
#> 4     4     0    10     1     6   210     0
#> 5     5     1    11     0    NA   210     0
#> 6     6     1     7     0    NA    90     0
The dataset contains the following:
- one row per individual (
ID) - a set of baseline covariates (
x1,x2) - exposure status (
V) with values1 = vaccinated, 0 = unvaccinated. - time to vaccination (
D_obs); for unvaccinated individuals this is left asNA. - right censored survival data
(Y, event)-
Yrepresents follow-up time for an outcome such as infection, hospitalization or death. -
eventindicates whether individual experienced the event or censoring with values1 = event, 0 = censored.
-
# Use nomatch to compute cumulative incidence and effect estimates
fit <- nomatch(data = simdata,
outcome_time = "Y",
outcome_status = "event",
exposure = "V",
exposure_time = "D_obs",
covariates = c("x1", "x2"),
immune_lag = 14,
timepoints = seq(30, 180, by = 30),
boot_reps = 10)
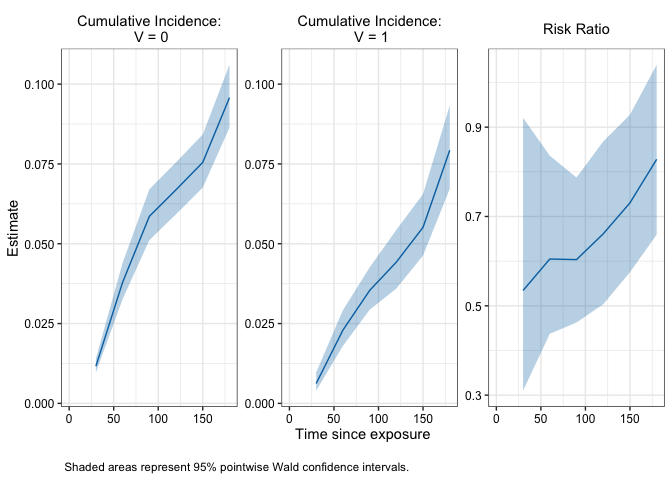
# Examine object produced by nomatch - shows risk ratio estimates by default
fit
#>
#> Risk Ratio Estimates
#> ==================================================
#> Call: nomatch(data = simdata, outcome_time = "Y", outcome_status = "event",
#> exposure = "V", exposure_time = "D_obs", covariates = c("x1",
#> "x2"), immune_lag = 14, timepoints = seq(30, 180, by = 30),
#> boot_reps = 10)
#>
#> Result:
#> Timepoint Estimate 95% Wald CI: Lower 95% Wald CI: Upper Wald p-value
#> 1 30 0.534 0.310 0.921 0.024016
#> 2 60 0.605 0.437 0.836 0.002347
#> 3 90 0.603 0.463 0.787 0.000195
#> 4 120 0.661 0.504 0.868 0.002896
#> 5 150 0.731 0.575 0.928 0.010058
#> 6 180 0.828 0.659 1.040 0.104331
#>
#> Use summary() for more details
#> Use plot() to visualize results
# Plot cumulative incidence and effect estimates
plot(fit)